The Fenton Brief
MarsCoin (MARSCOIN) is no ordinary meme token.
Built on BNB Smart Chain, it combines speculative trading with rewards distributed in SPCXB, a separately issued tokenized security linked to SpaceX shares.
Two developments have strengthened its market narrative:
- September 4, 2026: Binance listed MARSCOIN for spot trading.1
- September 28, 2026: Binance announced additional SPCXB rewards for eligible MARSCOIN holders, funded partly by exchange trading fees.2
Yet MARSCOIN was trading approximately 64% below its September peak at the time of this research.
The disconnect raises a fundamental question: If the rewards are real, why has the market assigned substantially less value to the token?
Our findings suggest three things.
First, MarsCoin's reward mechanism is more substantive than a typical meme-token promise.
Second, large token balances held by exchange wallets make headline holder-concentration statistics potentially misleading.
Third, neither the historical rewards nor Binance's additional incentives currently establish a defensible fundamental valuation.
Fenton's assessment: MarsCoin has a genuine differentiator. What remains unproven is whether that differentiator creates enough lasting economic value to justify the price investors pay.
1. What exactly is MarsCoin?
MarsCoin describes itself as a stock coin, combining the viral appeal of a Mars-themed meme asset with a tokenized-equity rewards mechanism.
Its BNB Chain contract is:1
0xFe189E97832DA1573e4e4Ff034F4fFC3a15c7777
The connection to SpaceX is the central attraction—and the first distinction investors must understand.
MARSCOIN is not SpaceX stock.
Owning MARSCOIN does not provide SpaceX shares, shareholder voting rights, or a claim on the company's profits.
SPCXB, the asset used for rewards, is itself a separate tokenized security issued by BTech Holdings Limited under Binance's bStocks framework. It represents an interest linked to underlying securities held by the issuer, rather than direct share ownership.3
That creates two distinct layers of risk: the speculative market for MARSCOIN and the legal, custody, regulatory, and market risks of SPCXB.
The MarsCoin name also has historical baggage.
A 2021 exchange between Elon Musk and Binance founder Changpeng Zhao popularized the idea of a cryptocurrency associated with Mars. However, those comments do not establish that either person created, backs, or endorses this particular BNB Chain token.
It should also not be confused with the older Marscoin (MARS) cryptocurrency launched in 2014.
The investment thesis must stand on the current project's actual economics—not celebrity association.
2. The reward economy: Innovation with a cost
The project's defining mechanism is its SPCXB rewards vault.
According to the MarsCoin website, applicable trades are subject to a 3% buy charge and a 3% sell charge, helping finance distributions to eligible holders.4
At our research snapshot, its dashboard displayed approximately:
| Project-reported metric | Value |
|---|---|
| Historical SPCXB distributed | 32,090 SPCXB |
| Displayed cumulative reward value | $5.1 million |
| SPCXB awaiting distribution | Approximately 90 |
| Advertised buy/sell charges | 3% / 3% |
Source: MarsCoin's project dashboard, accessed October 10, 2026. These figures are project-reported, not independently reconciled against all historical payouts and SPCXB prices.4
The distribution history is worth investigating. However, cumulative rewards cannot be treated as an annual yield or compared directly with today's token valuation without knowing who received them, when, and how much capital they committed.
The hidden break-even hurdle
Consider a hypothetical $1,000 purchase through a route applying both advertised 3% charges.
After the entry charge, the investor receives approximately $970 of token value at the quoted price.
If the price remains unchanged, the 3% exit charge reduces the proceeds to approximately $940.90.
That is a 5.91% round-trip reduction, before other trading costs.
To recover the original $1,000, the underlying token price must rise approximately 6.28%.
This calculation is conditional. These project-described charges should not automatically be assumed to apply to Binance spot trades or every on-chain route.
For a longer-term investor, the equation is different:
Net economic return = Change in MARSCOIN value + Realized SPCXB rewards − Trading and holding costs.
This distinction matters because rewards can be distributed successfully while the underlying position loses considerably more value.
The key missing metric is not total rewards paid. It is realized reward yield per dollar of eligible capital, measured over a defined period.
Without that information, rewards are a product feature—not proof of attractive investment returns.
3. Binance changed the equation. But by how much?
The September 28 announcement introduced a second rewards component alongside the existing on-chain arrangement.
Binance specified two sources:2
| Reward component | Funding mechanism |
|---|---|
| On-chain rewards | SPCXB allocated through project arrangements |
| Binance platform rewards | 30% of applicable MARSCOIN spot trading fees, allocated as additional SPCXB rewards |
The distinction is important.
Binance did not announce that 30% of trading volume would be distributed, nor did it guarantee a fixed yield.
It committed a portion of applicable spot trading fees to an additional reward pool, until further notice.
That makes the exchange's reward support meaningful, but conditional.
Who qualifies?
Under the announced Binance program:2
- A user's daily MARSCOIN balance must exceed 10,000 tokens to qualify.
- Binance takes one random holdings snapshot each day.
- Monthly rewards depend on each eligible user's proportion of aggregate qualifying holdings.
- Account verification, supported account types, product access, and jurisdictional eligibility apply.
- Binance may adjust or terminate the additional platform rewards.
At a reference price of $0.094, 10,000 MARSCOIN represents about $940.
But eligibility is not profitability.
Fenton's reward sensitivity test
Consider a purely illustrative month:
An investor holds 20,000 qualifying MARSCOIN throughout the month. Assume the aggregate eligible balance remains 100 million MARSCOIN and the monthly rewards available for distribution are worth $20,000.
The investor's share would be:
20,000 ÷ 100,000,000 = 0.02%
That would produce approximately $4 in monthly rewards.
At $0.094 per token, the investor's position would be worth approximately $1,880.
The example is not a forecast. Neither the hypothetical reward pool nor the aggregate eligible holdings has been verified as an actual monthly observation.
It demonstrates the economic variable that matters: an investor's allocation depends not only on reward generation but also on how many other tokens qualify.
More trading can increase the pool. More qualifying holders can dilute each participant's share.
Until actual distributions, eligible balances, and holding-period costs can be reconciled, assigning MarsCoin a yield-based valuation would be premature.
4. Valuation: What does $94 million actually buy?
Market snapshot — October 10, 2026
| Metric | Approximate value |
|---|---|
| MARSCOIN price | $0.094 |
| Market capitalization | $94 million |
| Circulating supply | 1 billion |
| Maximum supply | 1 billion |
| Market cap / FDV | 1.0 |
| CoinMarketCap reported 24h volume | $27.7 million |
| Historical high | $0.2634 |
| Decline from peak | 64% |
Sources: CoinMarketCap and CoinGecko. Rounded observations from October 10; provider calculations and observation times differ.65
At the reported one-billion-token circulating supply, MarsCoin's market capitalization and fully diluted valuation are approximately equal.
That reduces the apparent dilution gap associated with large, undistributed allocations.
However, it does not establish decentralized ownership or eliminate the possibility of meaningful selling pressure from existing holders.
Consider two valuation scenarios.
| MARSCOIN price | Implied market cap |
|---|---|
| $0.094 | $94 million |
| $0.20 | $200 million |
| $0.2634 | $263.4 million |
At $0.20, the token would command a valuation of $200 million—more than twice the current reference valuation.
That would represent an additional $106 million in implied market capitalization, although it would not necessarily require $106 million in new cash inflows. Market cap is a price-derived valuation, not a measurement of capital invested.
What would justify such a repricing?
Possibilities include greater demand for holding MARSCOIN, higher expected future rewards, and stronger speculative participation.
But these possibilities are not equivalent to demonstrated fundamental value.
There is no independently established relationship showing how a given amount of future SPCXB distributions should translate into a particular MARSCOIN price.
Fenton's interpretation: The supply figures are comparatively simple. The valuation is not.
5. Holder concentration: The number that needs context
Holder distribution is one of the most revealing—and frequently misinterpreted—metrics in token research.
CryptoRank's holder tracker reported approximately 51,146 MARSCOIN addresses, with the 100 largest addresses controlling roughly 88.4% of supply.7
At first glance, that looks extremely concentrated.
But identifying the addresses changes the interpretation.
Fenton's wallet-distribution breakdown
| Holder category | Share of total supply |
|---|---|
| Top 10 addresses combined | ~65.0% |
| Binance-labelled addresses among top 10 | ~55.0% |
| Gate.io-labelled address among top 10 | ~1.2% |
| Remaining unlabelled addresses among top 10 | ~8.8% |
Source: CryptoRank's MARSCOIN rich list, reviewed October 10, 2026. Figures are rounded. Wallet labels are third-party classifications and have not been independently verified by Fenton.7
This is a critical distinction.
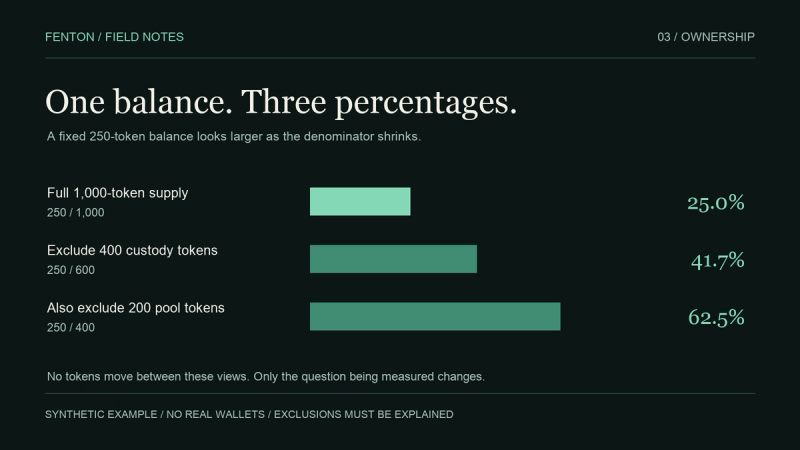
Exchange hot wallets often aggregate customer deposits. A wallet containing 27% of supply does not necessarily represent one investor controlling 27%.
The identified exchange-labelled addresses collectively account for approximately 56% of supply among the ten largest wallets.
Consequently, the raw top-ten figure cannot reasonably be presented as evidence that ten independent investors control 65% of MarsCoin.
Neither does the remaining unlabelled portion prove that those wallets belong to unrelated investors.
A complete beneficial-ownership assessment would require deeper classification, transaction history, and wallet-clustering analysis.
Fenton's finding: MarsCoin's on-chain balances are heavily concentrated in large addresses, but a substantial portion is associated with exchange custody. Raw wallet concentration overstates what can be concluded about independent holder control.
The distinction matters for evaluating selling pressure, reward eligibility, and genuine ownership diversification.
6. Liquidity: Trading volume is not exit capacity
MarsCoin's reported daily trading volume is substantial relative to its capitalization.
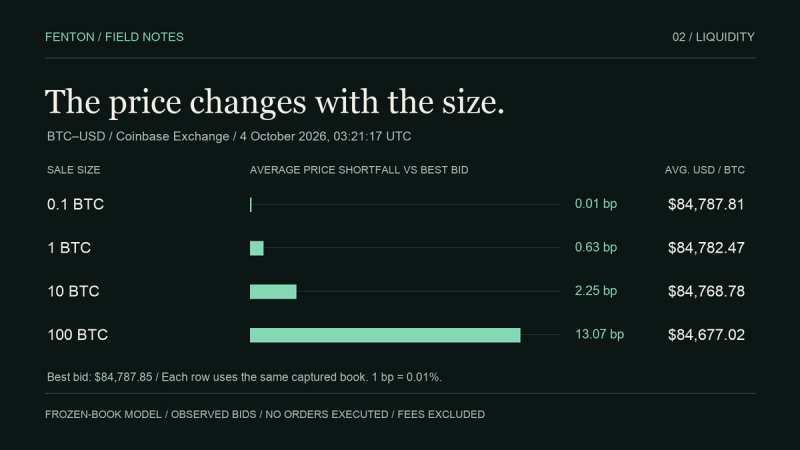
But volume describes activity over time. It does not reveal how much can be sold immediately at an acceptable price.
CoinGecko's order-book snapshot showed approximately $127,000 in bid-side depth within 2% below the quoted price on Binance's MARSCOIN/USDT market.6
Separately, GeckoTerminal reported approximately $1.7 million in total liquidity in the tracked SPCXB/MARSCOIN decentralized pool.8
These are different markets and different metrics. Their liquidity cannot simply be added together.
To illustrate the distinction, a hypothetical $100,000 sell order would be equivalent to approximately 79% of the reported Binance bid-side depth within that 2% price band.
That does not predict a 2% loss or a specific execution price. Orders can be cancelled, refreshed, or filled through different routes.
It demonstrates why immediately executable demand matters more than headline turnover.
There is also a broader distinction between centralized and decentralized markets.
Exchange order books depend on resting bids, spreads, and market-maker behavior. Decentralized pools depend on reserves, routing, fee structures, and the price impact of swaps.
Both can deteriorate under stress.
Fenton's finding: MarsCoin has established trading access and observable liquidity, but its market capitalization offers no guarantee that larger holders can exit near the displayed price.
7. Technical picture: The market has already repriced the story
MarsCoin reached approximately $0.2634 on September 5, shortly after its Binance listing.
By October 10, it was trading near $0.094.
That represents a drawdown of approximately 64%.
Returning from $0.094 to its previous high would require a gain of approximately 180%.
This asymmetry is important: recovering a large percentage decline requires a much larger subsequent percentage increase.
The observed seven-day price range was approximately $0.087–$0.117.6
Those boundaries offer useful areas to monitor, but should not be mistaken for independently validated support and resistance levels.
A stronger technical recovery would require sustained buying interest, improving spot liquidity, and evidence that rallies are being supported by demand rather than short-lived speculation.
Continued weakness near recent lows, especially alongside deteriorating liquidity, would reinforce the bearish scenario.
This report does not claim a confirmed Elliott Wave count, reversal pattern, or momentum-indicator signal. A comprehensive candle-by-candle technical study was outside its scope.
The more important market observation is that the Binance listing and rewards announcements have not yet restored the token to its earlier peak valuation.
A genuine catalyst does not guarantee a sustained bullish trend.
8. Bull case versus bear case
| Bull case | Bear case |
|---|---|
| Binance support provides wider market access | The initial listing premium may already have faded |
| SPCXB rewards create an unusual holding incentive | Realized rewards may be small relative to invested capital |
| Trading activity can contribute to reward funding | Lower trading activity can weaken the reward economy |
| Tokenized-equity exposure creates a differentiated narrative | MARSCOIN holders have no direct SpaceX equity rights |
| Broader adoption could support demand | Existing holders and liquidity constraints could limit recoveries |
Neither case should be accepted without measurable evidence.
What would change Fenton's assessment?
We would become more constructive if the following developments were demonstrated:
1. Transparent reward economics. Published distributions reconciled with recipient eligibility and capital committed over a consistent period.
2. Improving ownership quality. Evidence of broader independent ownership after excluding exchange and contract balances.
3. Stronger market depth. Sustained improvement in executable spot liquidity, rather than a temporary increase in reported volume.
4. Resilient demand. Price stabilization and recovery supported by sustained spot participation across multiple trading sessions.
Conversely, declining reward generation, weakening liquidity, greater concentration of independently controlled holdings, or significant changes to eligibility rules would weaken the thesis.
These are observable tests—not price predictions.
9. The Fenton Verdict
MarsCoin deserves more scrutiny than a conventional meme token.
Its Binance listing is verified. Its SPCXB reward arrangements are documented. Its tokenized-security connection offers a distinctive market proposition.
The available data also reveals why investors should resist simple conclusions.
Exchange custody distorts headline holder concentration. Trading volume does not guarantee exit liquidity. Historical reward distributions do not establish future yield.
Most importantly, the existence of real rewards does not establish that MARSCOIN is fundamentally undervalued.
For now, MarsCoin remains a high-risk, narrative-sensitive crypto asset with an unusual but incompletely measured rewards economy.
Its strongest potential advantage is that the economics can, in principle, be measured and tested.
Whether they ultimately support the token's valuation remains unanswered.
Fenton's conclusion
MarsCoin has moved beyond a story built entirely on meme culture.
It has a functioning market, a documented exchange-supported rewards arrangement, and a recognizable connection to tokenized securities.
That makes it a legitimate subject for deeper research.
It does not make every market valuation reasonable.
The opportunity is in the mechanism. The risk is in the price investors are willing to pay for it.
Fenton Brief
Research before the hype.
Independent intelligence on crypto markets, token economics, liquidity, wallets, and emerging opportunities.
Subscribe to the free weekly research briefing at fenton.markets.