A token holder chart is a useful map of balances at a stated moment. It is not a register of people. Start by asking what was counted, on which chain and contract, and which supply total sits beneath every percentage. Then examine the account labels before turning a balance into an ownership claim.
A large slice can be a warning sign, an operational address, or a mix of claims held through one intermediary. The chart cannot settle which interpretation is right by itself. Its strength is narrower and still valuable: it makes concentration visible enough to investigate. Read the observation first, then add labels and risk in separate steps.
Read the observation literally
Ethereum distinguishes externally owned accounts from contract accounts, and both can hold tokens. Start with what the chain records: a balance at an address, for a particular token and chain. That is a narrower statement than saying an identified person owns or can immediately sell those units.1
Etherscan describes its token holder list as a current list of ERC-20 holder addresses and token balances. Its response contains addresses and quantities. It does not, by that fact alone, verify who ultimately benefits from each balance. Treat any explorer name tag as a lead to inspect, not proof of a person’s identity.2
The word “current” matters. A current balance list cannot be used as a historical ownership picture without a historical query or saved observation at the earlier block or time. If a chart is compared with a past price event, align the timestamps before inferring that today’s largest addresses were the largest then. Even a correctly labeled present-day address may have held a different balance at the time of interest.
The denominator can rewrite the headline
Consider a fictional token with exactly 1,000 units in this exercise. We assign 400 units to an assumed custody address, 250 to an assumed vesting contract, 200 to an assumed liquidity pool and 150 to other addresses. The assignments are explanatory labels only; none describes a real token, venue or person.
| Assumed category | Units | Share of 1,000 | What remains unknown |
|---|---|---|---|
| Custody address | 400 | 40% | Number and allocation of underlying claims |
| Vesting contract | 250 | 25% | Release terms and who can direct transfers |
| Liquidity pool | 200 | 20% | Pool ownership and withdrawal rights |
| Other addresses | 150 | 15% | Whether control is independent or shared |
400 + 250 + 200 + 150 = 1,000. Each share divides its row by 1,000. Categories are assumed only for this illustration.
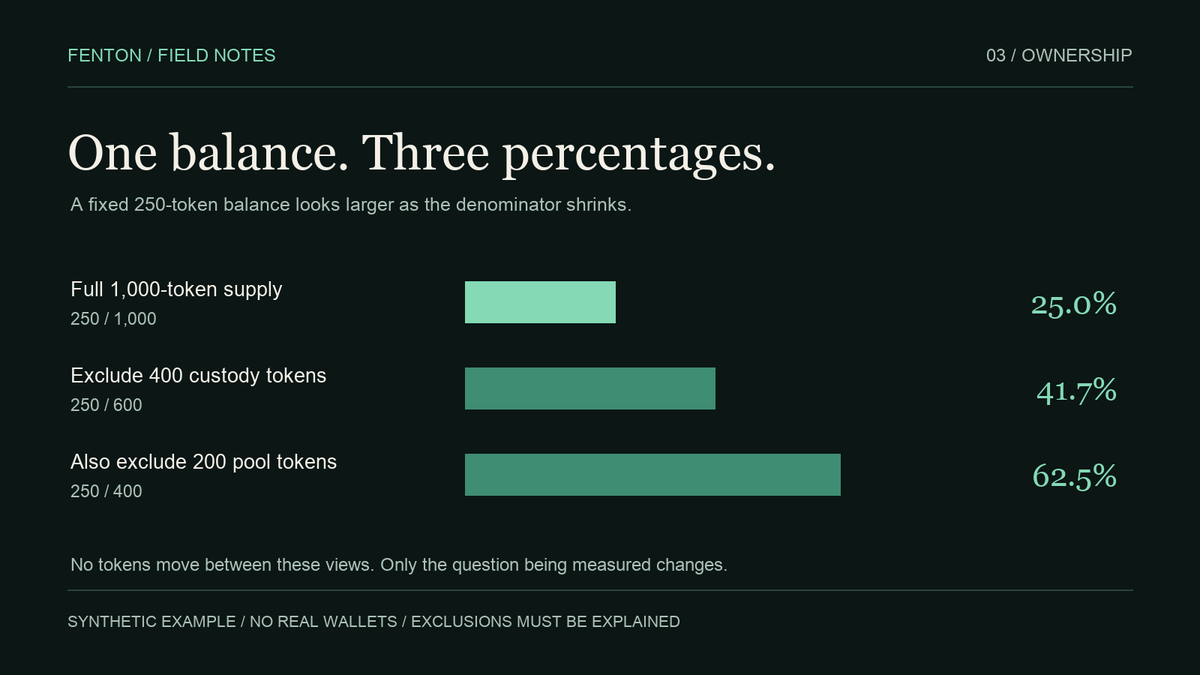
The assumed vesting balance is 250 tokens, or 25% of the full 1,000-token example. Exclude the 400 custody tokens and its share becomes 250 / 600 = 41.7%. Exclude the 200 pool tokens as well and it becomes 250 / 400 = 62.5%. No tokens moved. The three figures measure different universes.
Each adjusted percentage must name the categories excluded and the denominator retained. Preserve the full-supply chart alongside the adjusted views so readers can reproduce the change and decide whether the exclusions are relevant to the research question.
| View | Denominator | Share of that view |
|---|---|---|
| Full supply | 1,000 | 25.0% |
| Custody category excluded | 600 | 41.7% |
| Custody and pool categories excluded | 400 | 62.5% |
250 ÷ denominator × 100; rounded to one decimal. These are assumed categories, not real addresses. The two adjusted shares must not be labeled share of total supply.
Check the label before inferring control
For an ERC-20 token, totalSupply reports the token supply and balanceOf reports a balance at a given address. Neither method classifies an address as an exchange, team wallet, bridge or private holder. Classification requires contract inspection, project records or other evidence tied to the same chain, token and observation time.3
A custody, vesting or pool label suggests a mechanism to investigate. It does not establish the terms for this particular account. Record the source of the label, its date and the evidence for transfer restrictions or intermediary claims. Keep unverified addresses in an “unknown” category rather than deleting them to make the chart easier to explain.
One actor can control several addresses; assigning them to one entity is an inference that needs supporting evidence. Address-clustering methods attempt that attribution, but a holder chart alone supplies neither the method nor its confidence. If you aggregate addresses, preserve the original observations and document why they were grouped.5
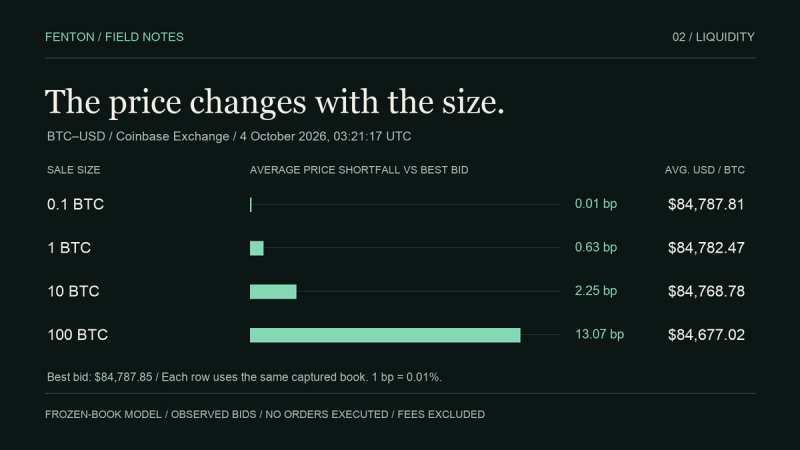
Even a verified large holder balance is not a measure of market impact. To assess the possible consequences of a transfer or sale, you would also need release conditions, observed movements and venue liquidity at a stated time and trade size. Address concentration and executable liquidity are complementary observations, not interchangeable risk scores.
A real custody case: the product changes the meaning
Coinbase describes Prime Custody and Prime Trading as omnibus structures without a separate on-chain address for each client. Its comparison describes Prime Vault as using dedicated addresses. The same broad “Coinbase” label can therefore refer to different account structures.4
For the shared structure, a large address balance cannot reveal each client’s economic share. A dedicated address narrows the account structure, but an outside holder chart still needs evidence to identify the beneficiary and relevant control arrangements. The documented design supports these questions; it does not attribute any address in our synthetic example.
A real governance case: UNI votes can be delegated
Uniswap’s voting guide says UNI holders can delegate voting power to themselves or another address while the tokens remain in their wallet. A distribution of delegated votes therefore answers a different question from a distribution of token balances.6
For a governance claim, inspect the relevant proposal’s voting-power snapshot and rules. For a sell-pressure claim, inspect balances, transfer restrictions and market access. A delegate’s voting weight is not automatically inventory the delegate can sell. This example illustrates the distinction; it does not estimate today’s UNI voting concentration.
| Question | Evidence to record |
|---|---|
| Where are token units recorded? | Contract, chain, block/time and address balances. |
| Who has the economic claim? | Custody or beneficiary records; state when unavailable. |
| Who can move the units? | Key/control evidence, contract permissions and transfer restrictions. |
| Who can exercise votes? | Delegation and proposal-specific voting-power records. |
An answer to one row does not automatically answer the others.
Five questions for your next holder chart
- Which chain and token contract does the display cover, and when was it observed?
- Is the denominator total supply, circulating supply or only the addresses shown?
- What evidence supports every material account label?
- Could one address combine many claims, or could several addresses share control?
- Which risk conclusion follows from balances alone, and which would require contract, market or governance evidence?
Download the blank holder evidence ledger (CSV).
Give each address its own row. Record the balance and denominator first; then add a proposed label, its evidence, confidence and unresolved questions. Keep the raw rows when creating an adjusted chart. If a large balance is unknown, report how that uncertainty limits the conclusion instead of silently converting an unlabeled address into a person.
What a chart cannot settle
The balance and exclusion calculations are synthetic. The Coinbase custody and UNI delegation cases describe documented real mechanisms; neither identifies the owners of a sampled wallet set. No universal concentration threshold follows from them. A token-specific report needs a dated balance dataset, defensible labels, contract context and a separate account of voting or market liquidity where relevant.
Keep the address distribution, evidence for each label and interpretation in separate layers. A chart can show where token balances sat at one observation. Establishing who had the economic claim, who could move the units and what a move might mean requires additional records. Leave those questions open when the evidence does.