A token can show a modest market cap and a much larger fully diluted valuation on the same screen. That is not necessarily a contradiction. The two figures multiply one observed price by different supply counts. Read those counts before treating either number as a conclusion.
That distinction matters because a valuation figure can look precise while its denominator is uncertain. A price feed may update continuously, but circulating supply can require editorial classification of treasury balances, locked allocations or unreleased tokens. The product of those inputs is only as comparable as the definitions behind them. The useful question is not which headline number is “correct” in isolation; it is which claim each number is able to support.
Begin with the two denominators
Market capitalization is commonly calculated as current price multiplied by circulating supply.1 Fully diluted valuation, or FDV, applies that price to a broader stated supply figure, commonly total supply.2 Some displays instead use maximum supply, so the denominator must be named.1 Always record the source, timestamp and exact supply definition before comparing the two.
| Measure | Assumed supply | At $2 per token | What the figure cannot establish |
|---|---|---|---|
| Market cap | 20 million circulating | $40 million | How much cash was invested or can be withdrawn |
| FDV | 100 million total | $200 million | What the future market cap or token price will be |
| Circulating / total | 20m / 100m | 20% | When remaining tokens become available or are sold |
Calculations: 20m × $2 = $40m; 100m × $2 = $200m; 20m ÷ 100m = 20%. All inputs are invented for this example.
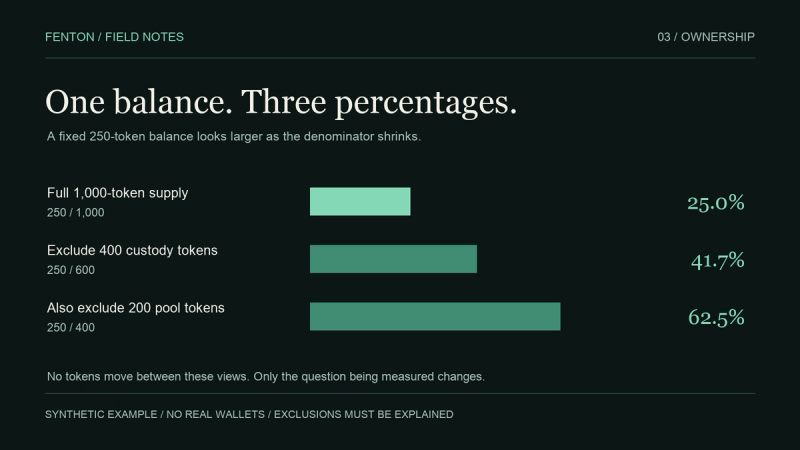
Here, the market cap is $40 million and the FDV is $200 million. The arithmetic is exact within the assumptions. The interpretation is narrower: four fifths of the stated total supply sits outside the circulating denominator. That fact alone does not say when those units become available, whether they will be transferred, or what price would prevail if supply changed.
The market-cap-to-FDV ratio in the example is 0.20, matching the circulating-to-total-supply ratio because both valuations use the same $2 price. That is a mathematical identity, not an independent risk score. A low ratio calls attention to supply outside circulation; it does not rank projects fairly unless their supply accounting, time horizons and token rights are comparable.
The gap is a question, not a forecast
FDV is a hypothetical calculation at today’s quoted price. It is not a forecast of tomorrow’s market cap. The price can change before any future release, and a release can have several stages: scheduled unlock, claimability, transfer and eventual trading are different observations. CoinGecko describes FDV as theoretical and notes that increasing circulation may itself affect the market price.2
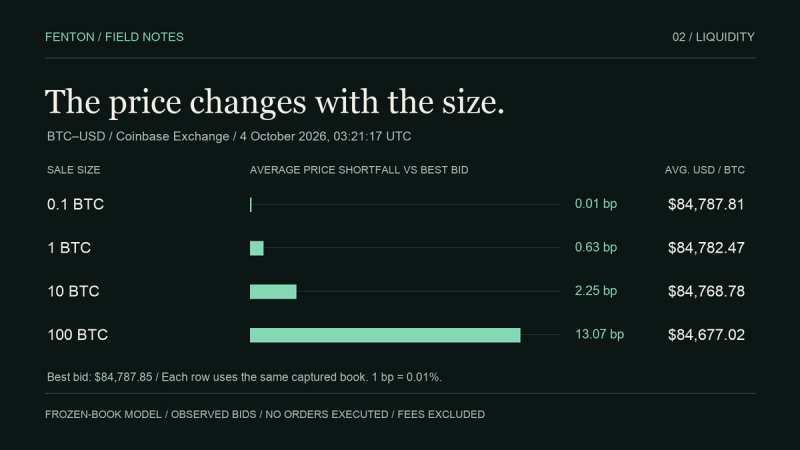
Market cap is also not the amount of money invested. It reprices every circulating unit at a marginal market price. A small trade can set the last price in a thin market; multiplying that price by all units does not create executable bids for all of them. This is why a valuation screenshot should lead to a liquidity check, not end the analysis.1
For an unlock, write down four separate times if the evidence permits: when a schedule says tokens may unlock, when they become claimable, when a transfer is actually observed, and when they appear in a venue or pool where they could be traded. These stages can be separated by days or may not all occur. Treating the scheduled date as an observed sale collapses distinct events into a claim the evidence does not support.
Ask where each supply figure came from
For an ERC-20 token, totalSupply returns the contract’s token supply, while balanceOf returns the balance assigned to an address.4 Neither method determines which units a data provider treats as circulating. That classification depends on a stated methodology and project information, which is why published supply figures can differ.3
Record whether a displayed FDV uses current total supply, a stated maximum, or another base. Check which balances the circulating-supply method excludes and whether minting or burning can change the denominator.1 Then compare those definitions with the project’s current release schedule. Without a source and observation time, the gap is difficult to audit.
When comparing two assets, first normalize the worksheet rather than the headline. Use the same quote currency and observation time. Write each provider’s definition of circulating supply beside the figure. Identify any planned supply that is not yet minted, and distinguish current total supply from a maximum cap. Only then ask how each release path intersects the market’s ability to absorb trading. Otherwise a side-by-side FDV ranking can conceal unlike inputs.
A real supply case: UNI at launch
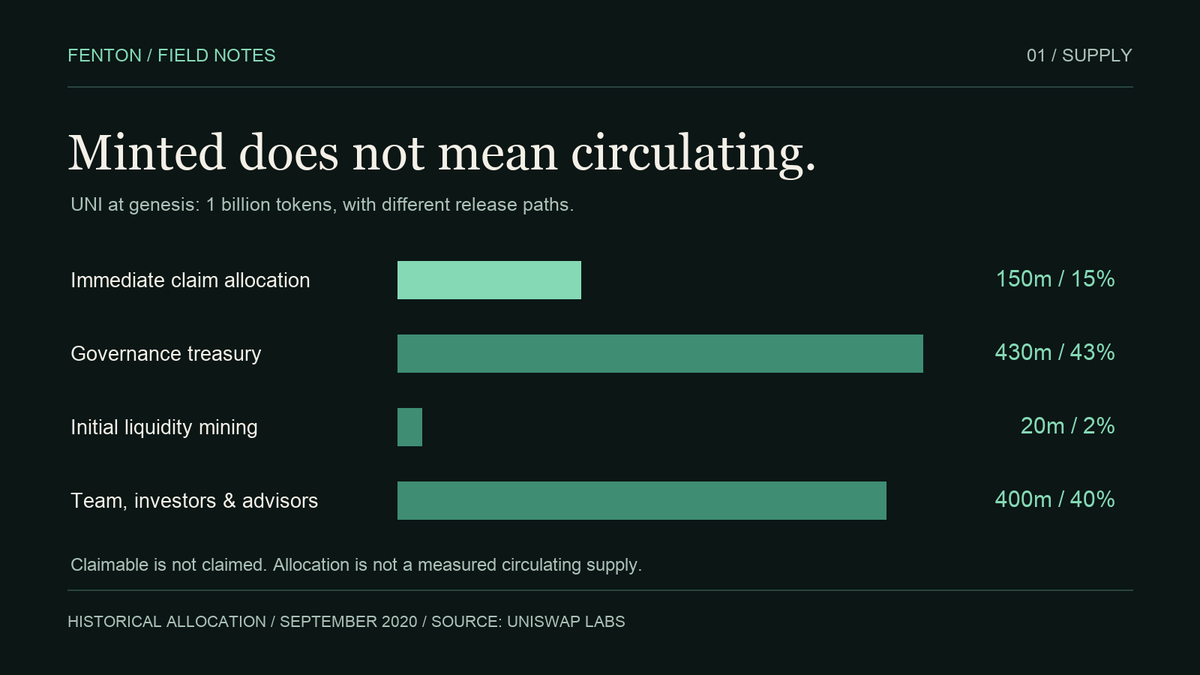
Uniswap’s September 2020 announcement reported 1 billion UNI minted at genesis. Of that supply, 150 million were immediately claimable by eligible historical participants; 430 million were assigned to the governance treasury with a four-year release schedule. Four initial mining pools were allocated 5 million each. The combined team, investor and adviser allocation was 400 million.5
| Allocation | UNI | Share of genesis |
|---|---|---|
| Historical participants: immediate claim allocation | 150,000,000 | 15% |
| Governance treasury | 430,000,000 | 43% |
| Initial liquidity mining: four pools | 20,000,000 | 2% |
| Team, investors and advisers combined | 400,000,000 | 40% |
| Total | 1,000,000,000 | 100% |
Source: Introducing UNI. Mining: 4 × 5m = 20m. Team/investors/advisers: 212.66m + 180.44m + 6.9m = 400m. Allocations are not a measured circulating supply.
The analytical lesson is to keep the measurement categories separate. A right to claim tokens does not show that they were claimed, transferred or sold. The 15% allocation cannot simply be substituted for circulating supply. A circulating-supply estimate would need a dated balance observation and an explicit inclusion method. This table makes no claim about UNI’s current supply or valuation.
Build a valuation worksheet you can audit
- Write down the price, venue or data provider, quote currency, and observation time.
- Record circulating, total and maximum supply separately; do not treat them as synonyms.
- Recalculate market cap and FDV from those inputs, and label any unavailable denominator.
- Separate scheduled release, actual claim, transfer and sale evidence.
- Inspect executable liquidity for a specified trade size and venue before comparing valuation with exit capacity.
Download the blank valuation worksheet (CSV).
| Finding | What to check next |
|---|---|
| The quoted FDV cannot be reproduced | Match price time, quote currency and total/max-supply definitions. |
| A large allocation becomes transferable | Check recipients, restrictions and the actual amount released. |
| Tokens move to a labeled exchange address | Verify the label and transfer; a deposit alone does not prove a completed sale. |
| An unlock is followed by a price move | Compare market-wide movement, news and liquidity before attributing causation. |
These are research questions. No single row establishes that an asset is cheap, expensive or about to fall.
What this guide does not establish
The arithmetic example is invented; the UNI allocation case is a historical primary-source record. Neither supplies a present-day UNI price, circulating-supply count or unlock forecast. A current asset assessment needs refreshed supply records and dated market observations. The worksheet is designed to preserve those inputs and expose what remains unknown.
Market cap marks the circulating denominator at one price. FDV applies the same price to a wider stated denominator. Their gap is a prompt to inspect supply definitions and release paths alongside liquidity—not a verdict that a token is cheap, expensive or bound to dilute holders by a predictable percentage.