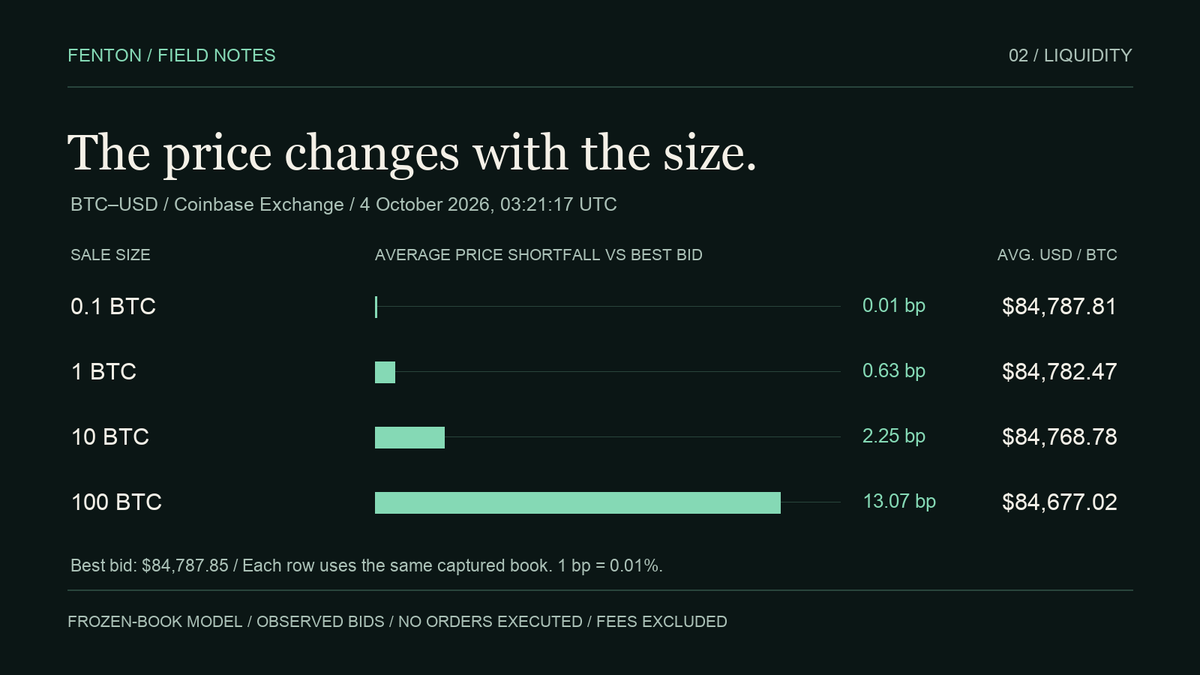
At 03:21:17 UTC on 4 October 2026, the highest displayed bid in a Coinbase Exchange BTC–USD snapshot was $84,787.85. Only 0.09429803 BTC was available at that level. A sale of 100 BTC could not receive the top price for every unit from those displayed bids. The quantity beside the price is part of the quote.6
This guide follows that single observation through four hypothetical sale sizes. It is a worked market-data example, not a live quote or a report of trades we placed. The distinction matters: a book can change while an order is traveling to the exchange. Freezing it is a useful way to learn the arithmetic, but an incomplete way to predict execution.
Start with the side of the market you would use
A seller meets bids; a buyer meets asks. The last trade records a completed transaction, while the book displays open bids and asks at multiple prices. In the sell-side model below, the calculation starts with the highest bid and proceeds to lower levels only when the requested quantity exceeds the size available above them.1
We retrieved the public BTC–USD Level 2 book in one response. Coinbase describes this level as aggregated: each size already sums the orders at that price. The order-count field must not be multiplied into the quantity.5
One captured book, four sale sizes
All four rows use the same bids, timestamped 03:21:17.686162335 UTC on 4 October 2026. The response reported auction mode disabled and sequence 137219138690. Sizes span orders of magnitude so the comparison exposes how the model responds to size. Prices and gross proceeds are in US dollars; fees are excluded.6
| Sale size | Gross proceeds | Average USD / BTC | Below best bid |
|---|---|---|---|
| 0.1 BTC | $8,478.78 | $84,787.81 | 0.01 bp |
| 1 BTC | $84,782.47 | $84,782.47 | 0.63 bp |
| 10 BTC | $847,687.77 | $84,768.78 | 2.25 bp |
| 100 BTC | $8,467,702.49 | $84,677.02 | 13.07 bp |
Frozen-book calculation, not actual fills. Benchmark: $84,787.85 best bid. USD rounded to cents; shortfall rounded to two decimal places. 1 bp = 0.01 percentage point. Full precision is in the downloadable archive.
The 100 BTC model consumes 297 price levels and reaches a final bid of $84,565.32. Its average is $84,677.02, or 13.07 basis points below the best bid. The last price reached and the average price are different measures: most units fill before the model reaches its lowest level.6
The small shortfall at 0.1 BTC and larger shortfall at 100 BTC describe this captured book. They do not justify a claim that Bitcoin is always liquid, that Coinbase always offers this depth, or that a smaller token would behave similarly. Persistence requires observations across time; a one-venue snapshot also omits alternative execution routes.
Download the raw snapshot, calculation script and full-precision results (ZIP).
Reproduce the result before trusting it
For each size, sort bids from highest to lowest and take the smaller of the displayed quantity or the remaining amount to sell. Add price × quantity at every consumed level. Use only the required portion of the final level. Divide gross proceeds by total BTC for the average. The shortfall is (1 − average / best bid) × 10,000 basis points.
The archive contains the unchanged response, exchange timestamp, sequence number, retrieval metadata and a Python script that runs without external packages. It uses decimal arithmetic, checks partial fills against a known example and refuses to extrapolate if displayed bids cannot fill a requested size. Full-precision results are saved before display rounding.
A pool answers the question differently
In an automated market maker such as Uniswap, a swap trades against pool liquidity rather than discrete order-book bids. Available liquidity along the trade’s path determines how the exchange rate changes. Uniswap describes price impact as the effect of the swap itself on the pool price.2
Concentrated-liquidity positions cover chosen price ranges. A position outside its range is inactive, so a headline amount of capital in a pool is not equivalent to depth available near the current price. To assess a swap, record the pool or route, trade direction, size, fee assumptions and observation time.3
The BTC order-book calculation above cannot be reused as an estimate of a Uniswap swap. A pool-based study needs its own state and swap calculation, including any relevant route and contract behavior. The shared question is narrower: what average exchange rate does a specified size imply under stated assumptions?
What the snapshot leaves out
| Model assumption | Why real execution may differ |
|---|---|
| Displayed bids remain available | Orders can be canceled, changed or reached by another trader. |
| Only visible depth is used | Hidden or replenishing liquidity may improve execution. |
| The requested size sweeps the book | Order limits, venue protections and account restrictions can change the outcome. |
| Fees are zero | Actual account fees lower net proceeds. |
| One observation represents the question | Depth can vary by time, volatility and trading venue. |
No orders were sent and no realized execution or persistent-liquidity claim is made.
Twenty-four-hour volume measures completed trading over a past interval. It is not a list of buyers still waiting at usable prices. A high-volume asset can therefore require a fresh depth check for a particular trade; a quiet last-trade chart can likewise conceal a changed book.4
A limit price can constrain the acceptable execution price while leaving an order unfilled.7 For swaps, Uniswap documents minimum-output and maximum-input checks that can cause execution to revert when conditions are not met.2 Such controls constrain the outcome; they do not make an earlier quote permanent.
The six fields a liquidity claim should show
Record the venue and pair, direction, size, timestamp, benchmark, and fee assumptions beside the result. Keep the raw observation so another reader can reproduce it. If the claim is about reliable exit capacity, repeat the observation under relevant conditions and report the range. A quoted price starts that investigation; the quantity available at each price gives it substance.